center - The center of the map. You can specify center as coordinates or as an address. |
 |
 |
signIt("center=0,0") |
 |
signIt("center=37.839622,-119.515182") |
 |
signIt("center=San%20Diego,%20California") |
size & scale - size - The width and height must be within the range of [50, 640]. Default: 600x400. scale - The pixel density of the image. scale=2 returns an image intended for 2× Retina displays. |
 |
 |
signIt("center=San%20Diego,%20California&scale=1") |
 |
signIt("center=San%20Diego,%20California&scale=2") |
t - The map type. Possible values: standard, hybrid, satellite, mutedStandard |
|
 |
signIt("center=37.839622,-119.515182&t=standard") |
 |
signIt("center=37.839622,-119.515182&t=hybrid") |
 |
signIt("center=37.839622,-119.515182&t=satellite") |
 |
signIt("center=37.839622,-119.515182&t=mutedStandard") |
 |
signIt("center=San%20Diego,%20California&t=standard") |
 |
signIt("center=San%20Diego,%20California&t=hybrid") |
 |
signIt("center=San%20Diego,%20California&t=satellite") |
 |
signIt("center=San%20Diego,%20California&t=mutedStandard") |
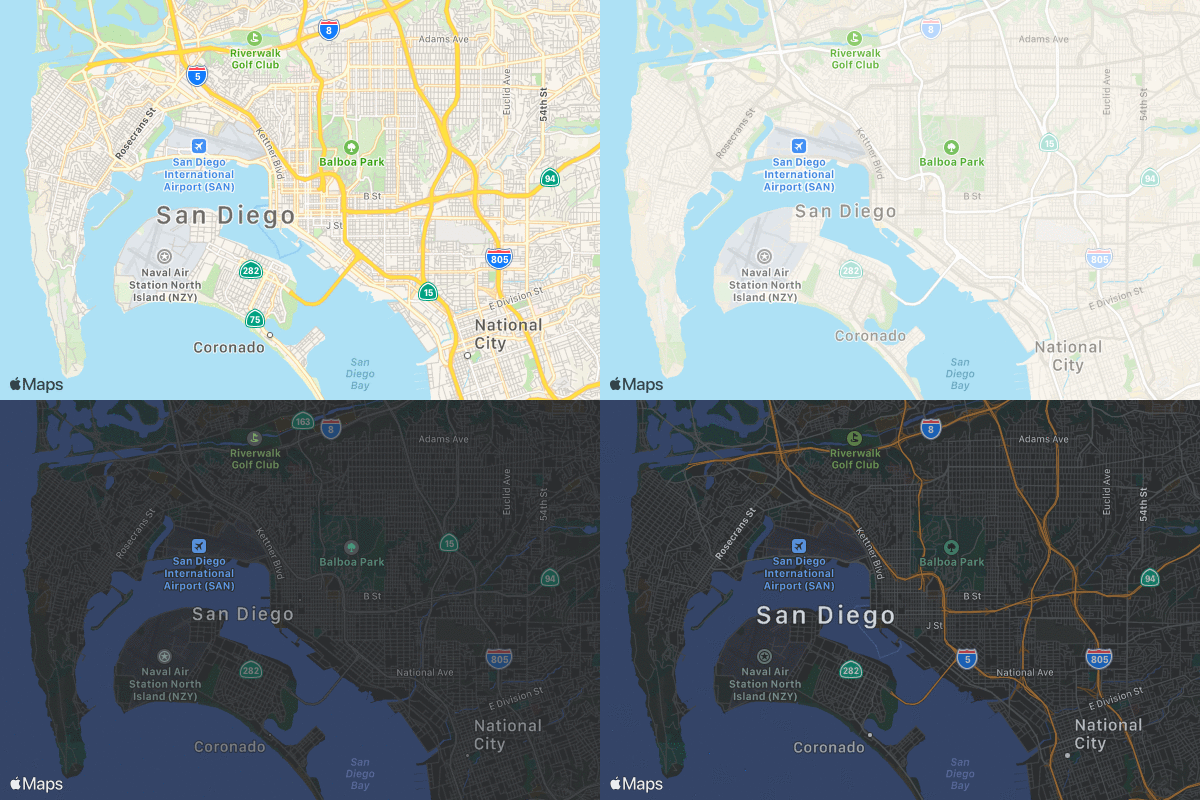
colorScheme - The color scheme of the map. Possible values: light, dark. The dark color scheme only applies to the standard and mutedStandard map types. |
|
 |
signIt("center=San%20Diego,%20California&t=standard&colorScheme=light") |
 |
signIt("center=San%20Diego,%20California&t=standard&colorScheme=dark") |
 |
signIt("center=San%20Diego,%20California&t=mutedStandard&colorScheme=light") |
 |
signIt("center=San%20Diego,%20California&t=mutedStandard&colorScheme=dark") |
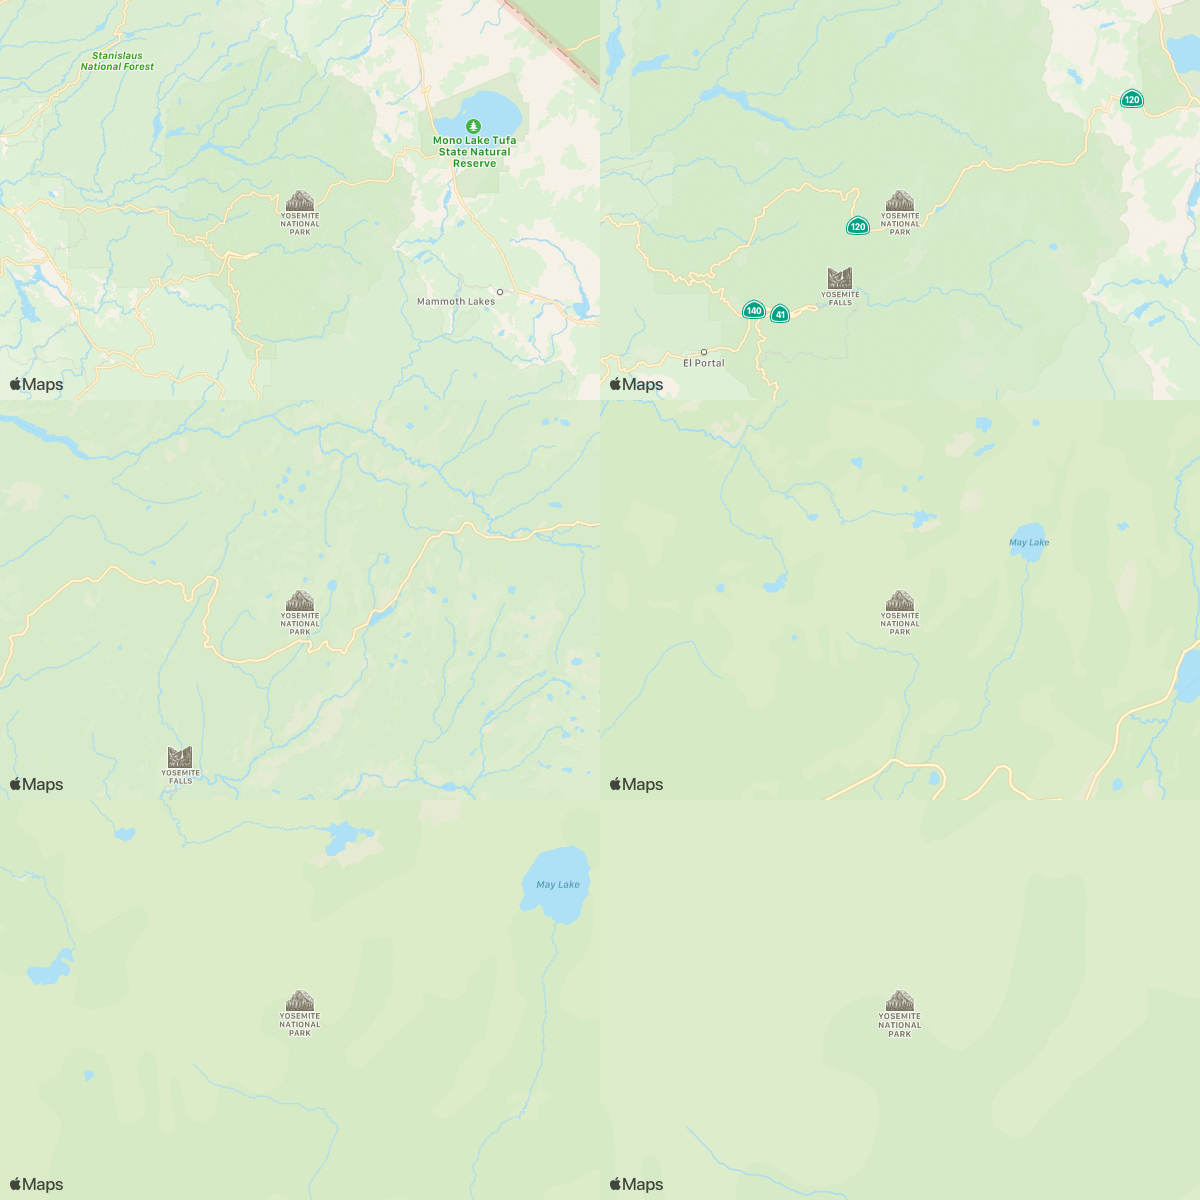
z - The zoom level of the map. |
|
 |
signIt("center=37.839622,-119.515182&z=15") |
 |
signIt("center=37.839622,-119.515182&z=14") |
 |
signIt("center=37.839622,-119.515182&z=13") |
 |
signIt("center=37.839622,-119.515182&z=12") |
 |
signIt("center=37.839622,-119.515182&z=11") |
 |
signIt("center=37.839622,-119.515182&z=10") |
 |
signIt("center=37.839622,-119.515182&z=9") |
poi - A Boolean value indicating whether points of interest are shown on the map. |
|
 |
signIt("center=San%20Francisco,%20California&t=mutedStandard&poi=0") |
 |
signIt("center=San%20Francisco,%20California&t=mutedStandard&poi=1") |
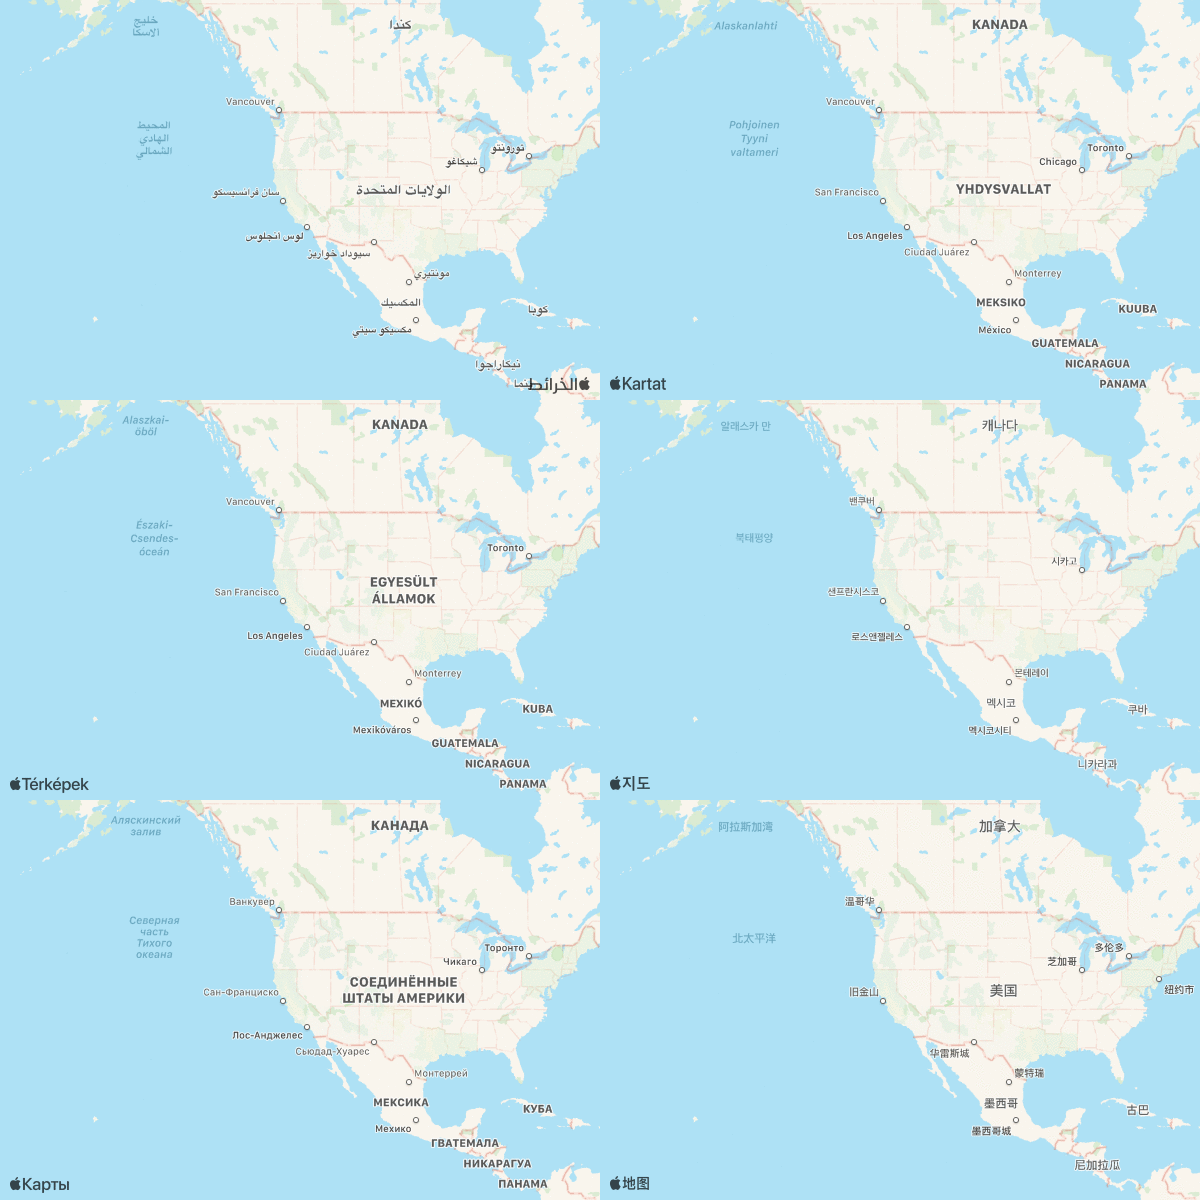
lang - The language to be used for labels on the map, Supported values are in locale IDs, such as en-GB or es-MX. |
|
 |
signIt("center=37.839622,-119.515182&z=3&lang=ar-AR") |
 |
signIt("center=37.839622,-119.515182&z=3&lang=de-DE") |
 |
signIt("center=37.839622,-119.515182&z=3&lang=en-US") |
 |
signIt("center=37.839622,-119.515182&z=3&lang=es-MX") |
 |
signIt("center=37.839622,-119.515182&z=3&lang=es-ES") |
 |
signIt("center=37.839622,-119.515182&z=3&lang=el-GR") |
 |
signIt("center=37.839622,-119.515182&z=3&lang=fi-FI") |
 |
signIt("center=37.839622,-119.515182&z=3&lang=fr-FR") |
 |
signIt("center=37.839622,-119.515182&z=3&lang=ja-JA") |
 |
signIt("center=37.839622,-119.515182&z=3&lang=hu-HU") |
 |
signIt("center=37.839622,-119.515182&z=3&lang=it-IT") |
 |
signIt("center=37.839622,-119.515182&z=3&lang=ko-KO") |
 |
signIt("center=37.839622,-119.515182&z=3&lang=nl-NL") |
 |
signIt("center=37.839622,-119.515182&z=3&lang=no-NO") |
 |
signIt("center=37.839622,-119.515182&z=3&lang=he-HE") |
 |
signIt("center=37.839622,-119.515182&z=3&lang=hi-IN") |
 |
signIt("center=37.839622,-119.515182&z=3&lang=pt-BR") |
 |
signIt("center=37.839622,-119.515182&z=3&lang=ru-RU") |
 |
signIt("center=37.839622,-119.515182&z=3&lang=tr-TR") |
 |
signIt("center=37.839622,-119.515182&z=3&lang=vi-VI") |
 |
signIt("center=37.839622,-119.515182&z=3&lang=zh-ZH") |
annotations - Example of Annotations . The array of JSON Annotation, which draws 3 points: a red dot , a green balloon , & blue large annotations, is shown [{"point":"32.73,-117.19", "color":"blue", "glyphText":"A", "markerStyle":"large"}, {"point":"32.71,-117.17", "color":"00ff00","glyphText":"9", "markerStyle":"balloon"}, {"point":"32.69,-117.16", "color":"red", "glyphText":"a", "markerStyle":"dot"} ] |
|
Live example of Annotations |
signIt("center=San%20Diego,%20California&<urlEncoded Annotations>") |
overlays - Example of Overlays. The array of JSON Overlay objects, which draws a red dashed line over 3 points, is shown: [{"points":["32.73,-117.19","32.71,-117.17","32.69,-117.16"],
"strokeColor":"ff0000","lineWidth":2,"lineDash":[10,5]}
] |
|
Live example of Overlays |
signIt("center=San%20Diego,%20California&<urlEncoded Overlay>") |
Live example of Annotations & Overlays, together |
signIt("center=San%20Diego,%20California&<urlEncoded Annotation & Overlay>") |